
VIP member
Product details
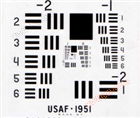
United States Air Force1951The annual resolution test chart has always been the universal standard for detecting vertical and horizontal resolution in the world, which is in line withMIL-STD-150AThe standard resolution test pattern was developed by the United States Air Force1951Year created.1951 USAFThe resolution test chart is still widely used to test the resolution capability of optical imaging systems such as microscopes and cameras. This pattern includes several combinations of three short lines, with the size of the short lines ranging from large to small. The maximum short line group that the imaging system cannot distinguish is its resolution limit.


usuallyMIL-STD-150AThe format consists of several layers, with the largest pattern forming the first layer located on the periphery. The shape of the smaller layer pattern remains unchanged, gradually shrinking from the periphery to the center. Each layer consists of two groups, each group containing6A graphic element, represented by numbers1to6Number. In the same layer, odd groups start from the top right corner and their elements are pressed from top to bottom1to6Arrange. The first element of the even group is located in the lower right corner of the layer, and the remaining elements are pressed from top to bottom on the left side2to6Arrange. The formula for calculating resolution is: resolution(line-pairs/mm)=2(Group ordinal number+((Element ordinal number-1)/6)).
|
Item Number |
Product Name |
Specifications |
|
R70 |
USAF Test Chart,Group 0-7(Main film),element 6,size50×50mm |
a |
|
R71 |
USAF Test Chart,Group-2-7(Main film),element 6,75×75mm |
a |
|
R75P |
USAF Test Chart,Group0-9(Main film),element 3,50×50mm |
a |
|
R75N |
USAF Test Chart,Group0-9(Negative film),element 3,50×50mm |
a |
|
PS75P |
USAF Test Chart,Group2-9(Main film),element 3,76×25mm |
a |
|
PS75N |
USAF Test Chart,Group2-9(Negative film),element 3,76×25mm |
a |
Online inquiry
-
Contacts
-
Company
-
Telephone
-
Email
-
WeChat
-
Verification Code
-
Message Content
-